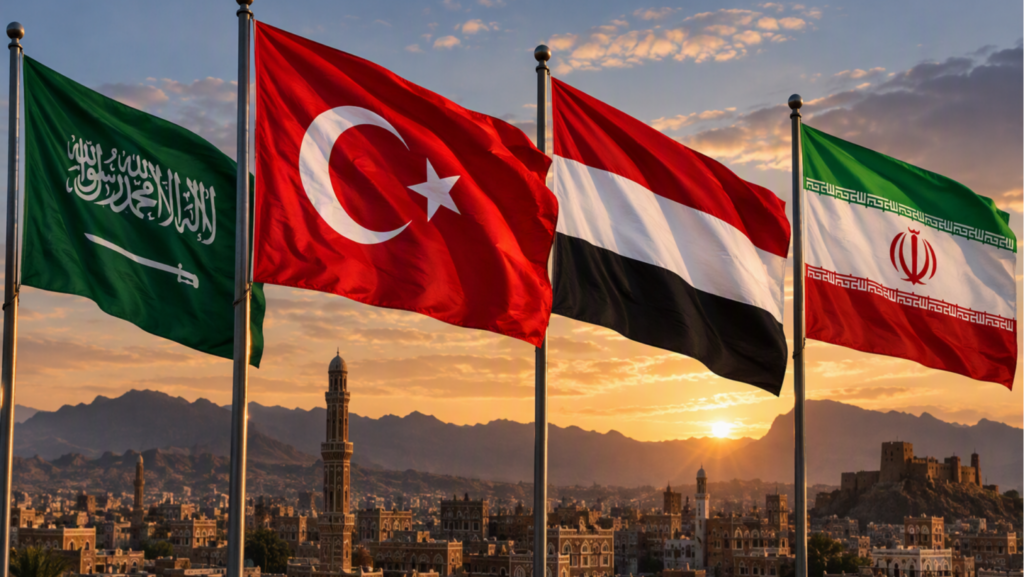
The Hormuz Crisis Arrives to the Americas
This article analyses how the rising crude prices and disrupted Gulf supply chains position Brazil as a key alternative exporter, even as broader geopolitical volatility reshapes global energy flows.
On February 28, 2026, coordinated U.S.-Israeli strikes on Iran under Operation Epic Fury (POLITICO, 28 Feb, 2026) initiated a chain of events that would close the Strait of Hormuz to most commercial shipping traffic, disrupting approximately 20 percent of global oil supply and triggering the largest energy shock since the 1970s oil crisis (NBC News, 2026; New York Times, 2026; Dallas Fed, 2026). Brent crude surpassed $126 per barrel at its peak and, while attempts have been made to stabilize the price of crude, all indicators point to a continued rise in oil prices. (Al Jazeera, 2026). While Asia bears the greatest direct exposure, the crisis has ruptured Latin America’s energy and agricultural supply chain dependency.
The Strait of Hormuz carries roughly 27 percent of global seaborne crude and petroleum product trade, along with significant volumes of LNG and fertilizer precursors (CRS, 2026). Iran’s declaration on March 4, 2026, that the strait was closed to vessels from the United States, Israel, and their allies effectively halted most global trade. The Dallas Federal Reserve’s model estimates that removing 20 percent of global oil supply during Q2 2026 would raise average WTI prices to $98 per barrel and reduce global real GDP growth by an annualized 2.9 percentage points (Dallas Fed, 2026). The International Energy Agency characterized the situation as the greatest global energy security challenge in history, releasing 400 million barrels from strategic reserves in an unprecedented response (FactCheck.org, 2026). As of April 14, 2026, WTI crude prices are at $96 dollars, a figure which is bound to fluctuate wildly as the war resumes (Trading Economics, 2026).
For Latin America’s net oil producers, the price surge represents a significant opportunity. Brazil, now producing over 4 million barrels per day following the start-up of new FPSO ships, is redirecting output toward the more profitable Asian markets that were previously supplied by Gulf producers (Latin America Reports, 2026). Shell Brasil’s president described the crisis as an enormous opportunity for Brazilian oil investment (Zawya. (2026). Colombia earns additional export revenue with each dollar rise in crude prices, while Venezuela, despite sanctions constraints, stands to gain from higher valuations on its 1.2 million barrel per day output. (OE, Digital, 2026; Atlantic Council, 2026). Guyana, now producing 900,000 barrels per day following the Yellowtail project’s ramp-up to full capacity, emerges as the hemisphere’s clearest beneficiary, combining one of the world’s fastest production growth trajectories with minimal domestic consumption and a Natural Resource Fund that recorded over $2.4 billion in inflows in 2025 alone (ExxonMobil Guyana, 2025).
For net importers, the calculus is reversed. Chile, which sources nearly all its crude domestically, faces direct inflationary pressure across transportation, industry, and household fuel costs (Latin America Reports, 2026). Central American and Caribbean states, with no meaningful domestic production and limited fiscal capacity to absorb price shocks, confront acute consumer price inflation. Nicaragua and Haiti are structurally the most at risk, combining zero domestic oil production with near-collapsed fiscal positions and no buffer against sustained price increases. UNCTAD has warned that rising energy, transport, and food costs could strain public finances and increase pressure on household budgets across developing economies already operating at or beyond their fiscal limits (UNCTAD, 2026).
Despite there being clear winners and losers in terms of the oil price spike, most of the Latin American states are exposed to other side effects of the crisis, creating a situation of dual exposure. A key element of this is fertilizer. Brazil consumes 45 million tons of fertilizer nutrients annually, importing over 80 percent of that supply, with a significant share transiting Hormuz from Gulf producers (FAO, 2023). Since Brazil accounts for approximately 60 percent of global soybean exports, a sustained fertilizer price surge threatens the agricultural sector underpinning its current account surplus, even as oil revenues rise. As a Columbia University energy researcher cautioned, rising LNG prices feed into domestic inflation through Brazil’s truck-dependent logistics network (Latin America Reports, 2026). Mexico produces 1.6 million barrels of oil per day but depends on imported refined products due to Pemex’s deteriorating refining capacity, meaning consumers face fuel inflation even as crude revenues grow (Financial World, 2026). Argentina gains on both oil and agricultural commodity prices but imports urea heavily for its wheat and corn sectors.
Methodology
To quantify these asymmetries, this analysis presents the Hormuz Exposure Index (HEI), a six-indicator composite scored out of 30, where lower scores indicate insulation or benefit and higher scores indicate critical exposure. Oil Trade Position (OTP) measures net export or import balance. Import Inflation Exposure (IIE) assesses domestic price sensitivity to oil import costs. Fiscal Resilience (FR) measures capacity to absorb the shock through public buffers, inverted so that lower fiscal space scores higher. Fertilizer and Food Vulnerability (FFV) capture agricultural supply chain exposure to the Hormuz fertilizer transit channel. Fuel Consumption Score (FCS) reflects absolute consumption relative to production buffers. Fertilizer Consumption Score (FertCS) reflects the tonnage of fertilizer dependency and associated agricultural inflation risk. Raw production, fuel consumption, and fertilizer consumption figures are included as contextual columns (EIA, 2025; Energy Institute, 2024; IFA/FAO, 2023).
Hormuz Exposure Index: Latin America and the Caribbean (2026)
| Country | OTP | IIE | FR | FFV | FCS | FertCS | HEI /30 | Prod. (kbd) | Fuel (kbd) | Fert. (kt) | FertCo (kt) | Source | |
| Haiti | 5 | 5 | 5 | 5 | 1 | 1 | 22 | Import Vulnerable | 0 | 20 | 50 | EIA 2024; Energy Institute 2024; IFA/FAO 2023 | |
| Brazil | 1 | 3 | 4 | 5 | 4 | 5 | 22 | Dual Exposure | 4000 | 3000 | 45000 | EIA/EnergiesNet 2025; Energy Institute 2024; IFA/FAO 2023 | |
| Cuba | 5 | 4 | 5 | 4 | 2 | 2 | 22 | Import Vulnerable | 35 | 130 | 200 | EIA 2024; Energy Institute 2024; IFA/FAO 2023 | |
| Puerto Rico | 5 | 5 | 4 | 3 | 3 | 2 | 22 | Import Vulnerable | 0 | 94 | 100 | EIA 2024; Worldometer 2024; IFA/FAO 2023 | |
| Nicaragua | 5 | 5 | 5 | 4 | 1 | 1 | 21 | Import Vulnerable | 0 | 35 | 150 | EIA 2024; Energy Institute 2024; IFA/FAO 2023 | |
| Dominican Republic | 5 | 5 | 3 | 4 | 2 | 2 | 21 | Import Vulnerable | 0 | 150 | 300 | EIA 2024; Energy Institute 2024; IFA/FAO 2023 | |
| Guatemala | 4 | 4 | 4 | 4 | 2 | 2 | 20 | Import Vulnerable | 5 | 90 | 500 | EIA 2024; Energy Institute 2024; IFA/FAO 2023 | |
| Honduras | 5 | 5 | 4 | 4 | 1 | 1 | 20 | Import Vulnerable | 0 | 60 | 300 | EIA 2024; Energy Institute 2024; IFA/FAO 2023 | |
| El Salvador | 5 | 5 | 4 | 4 | 1 | 1 | 20 | Import Vulnerable | 0 | 50 | 150 | EIA 2024; Energy Institute 2024; IFA/FAO 2023 | |
| Jamaica | 5 | 5 | 4 | 4 | 1 | 1 | 20 | Import Vulnerable | 0 | 50 | 50 | EIA 2024; Energy Institute 2024; IFA/FAO 2023 | |
| Mexico | 3 | 3 | 3 | 3 | 4 | 3 | 19 | Dual Exposure | 1600 | 1600 | 7000 | EnergiesNet 2025; Energy Institute 2024; IFA/FAO 2023 | |
| Chile | 5 | 5 | 2 | 3 | 2 | 2 | 19 | Import Vulnerable | 5 | 350 | 700 | EIA 2024; Energy Institute 2024; IFA/FAO 2023 | |
| Belize | 5 | 4 | 4 | 4 | 1 | 1 | 19 | Import Vulnerable | 2 | 10 | 20 | EIA 2024; Energy Institute 2024; IFA/FAO 2023 | |
| The Bahamas | 5 | 5 | 3 | 3 | 1 | 1 | 18 | Import Vulnerable | 0 | 22 | 15 | Worldometer 2024; EIA 2024; IFA/FAO 2023 | |
| Argentina | 2 | 2 | 4 | 4 | 3 | 3 | 18 | Dual Exposure | 860 | 800 | 5000 | EIA/EnergiesNet 2025; Energy Institute 2024; IFA/FAO 2023 | |
| Costa Rica | 5 | 5 | 3 | 3 | 1 | 1 | 18 | Import Vulnerable | 0 | 60 | 200 | EIA 2024; Energy Institute 2024; IFA/FAO 2023 | |
| Panama | 4 | 4 | 3 | 3 | 1 | 1 | 16 | Import Vulnerable | 0 | 100 | 100 | EIA 2024; Energy Institute 2024; IFA/FAO 2023 | |
| Uruguay | 4 | 4 | 3 | 2 | 1 | 2 | 16 | Dual Exposure | 0 | 55 | 400 | EIA 2024; Energy Institute 2024; IFA/FAO 2023 | |
| Ecuador | 2 | 2 | 4 | 3 | 2 | 2 | 15 | Dual Exposure | 468 | 250 | 600 | EnergiesNet 2025; Energy Institute 2024; IFA/FAO 2023 | |
| Peru | 3 | 3 | 2 | 3 | 2 | 2 | 15 | Dual Exposure | 46 | 250 | 800 | EnergiesNet 2025; Energy Institute 2024; IFA/FAO 2023 | |
| Paraguay | 4 | 3 | 2 | 3 | 1 | 2 | 15 | Dual Exposure | 0 | 55 | 800 | EIA 2024; Energy Institute 2024; IFA/FAO 2023 | |
| Colombia | 2 | 2 | 3 | 3 | 2 | 2 | 14 | Dual Exposure | 750 | 350 | 1500 | EnergiesNet 2025; Energy Institute 2024; IFA/FAO 2023 | |
| Venezuela | 1 | 2 | 5 | 2 | 2 | 2 | 14 | Dual Exposure | 1200 | 300 | 300 | EnergiesNet 2025; Energy Institute 2024; IFA/FAO 2023 | |
| Bolivia | 2 | 3 | 3 | 3 | 1 | 1 | 13 | Dual Exposure | 55 | 80 | 200 | EIA 2024; Energy Institute 2024; IFA/FAO 2023 | |
| Suriname | 2 | 3 | 3 | 3 | 1 | 1 | 13 | Dual Exposure | 80 | 15 | 30 | EIA 2024; Energy Institute 2024; IFA/FAO 2023 | |
| Falkland Islands | 3 | 3 | 2 | 2 | 1 | 1 | 12 | Dual Exposure | 0 | 1 | 5 | Worldometer 2024; EIA 2024; IFA/FAO 2023 | |
| Guyana | 1 | 2 | 1 | 2 | 1 | 1 | 8 | Exporter Beneficiary | 720 | 30 | 50 | EIA/EnergiesNet 2025; Energy Institute 2024; IFA/FAO 2023 | |
| Trinidad and Tobago | 1 | 1 | 2 | 2 | 1 | 1 | 8 | Exporter Beneficiary | 60 | 40 | 30 | EnergiesNet 2025; Energy Institute 2024; IFA/FAO 2023 | |
| OTP = Oil Trade Position | IIE = Import Inflation Exposure |
| FR = Fiscal Resilience (inverted) | FFV = Fertilizer & Food Vulnerability |
| FCS = Fuel Consumption Score | FertCS = Fertilizer Consumption Score |
| kbd = thousand barrels per day | kt = thousand tonnes nutrients |
Sources: EIA Short-Term Energy Outlook 2025; EnergiesNet 2025; Energy Institute Statistical Review 2024; IFA/FAO 2023; Dallas Fed 2026.
| 1-5: Low / Exporter Benefit | 6-10: Moderate Exposure | 11-18: Elevated Exposure | 19-30: Critical Exposure |
The index reveals three structural findings. First, Brazil and Haiti share the highest composite score in the dataset at 22/30, yet for entirely different reasons: Brazil’s score reflects the dual exposure paradox, with oil production buffering one channel while fertilizer import dependency opens another; Haiti’s score reflects pure vulnerability across all dimensions with no production offset. Second, Mexico and Chile both score 19/30 through distinct pathways, confirming that the refining paradox and import dependency produce equivalent risk outcomes despite fundamentally different economic profiles. Third, Guyana and Trinidad and Tobago score 8/30, the lowest in the dataset, confirming their status as the hemisphere’s most insulated beneficiaries. The raw data columns contextualize these scores: Brazil’s 45 million tons fertilizer consumption dwarfs every other country in the dataset and explains why its dual exposure score is analytically irreducible to a simple winner-loser classification.
Recommendations
Several recommendations must follow: First, the diversification of fertilizer and phosphate suppliers is necessary. Countries such as Brazil and Argentina should urgently diversify fertilizer import sources away from Gulf producers, accelerating partnerships with regional actors, North African and domestic suppliers to protect the 2026 planting cycle. Given that fertilizers are an expensive and power intensive process, energy rich states such as Guyana have opportunities to invest in these sectors. Second, the United States and other American actors such as Mexico & Brazil should extend emergency fuel access arrangements to the most exposed Central American and Caribbean states, where the danger of fuel shortages and fiscal shortfalls create conditions for acute social instability if the closure extends beyond Q2 2026. Regional Banks should prepare to offer rapid disbursement to high-HEI importers to prevent energy-driven fiscal pressures from cascading into sovereign debt distress across the region’s most vulnerable economies. Lastly maintaining diversification efforts away from oil reliance is necessary and must be upscaled as oil prices remain unstable in the foreseeable future.
The Hormuz crisis has affected Latin America in diverging ways, but the interconnected nature of the global economy means that this region will be adversely affected either by one flank or both. Exporters will gain from the crisis such as Brazil, Colombia, and Guyana, but these boons arrive bundled with a fertilizer supply shock that threatens the agricultural export base on which those same economies depend, not to mention of the looming inflationary troubles scarcity of fuel resources may have on the economies of these countries. The importer penalty falls hardest on states that were already fragile before the first barrel stopped moving through the strait. For a region so dependent on exports & commodity driven economies, supply chain disruptions such as that of Hormuz will be dangerous if not addressed and the effects will ripple in the region down the line throughout the months.
References
Al Jazeera. (2026, March 11). Iran’s IRGC says not one litre of oil will get through Strait of Hormuz. https://www.aljazeera.com/news/2026/3/11/irans-irgc-says-not-one-litre-of-oil-will-get-through-strait-of-hormuz
Congressional Research Service (CRS). (2026). Iran conflict and the Strait of Hormuz: Impacts on oil, gas, and other commodities (R45281). https://www.congress.gov/crs-product/R45281
Dallas Federal Reserve. (2026, March 20). What the closure of the Strait of Hormuz means for the global economy. https://www.dallasfed.org/research/economics/2026/0320
Energy Institute. (2024). Statistical review of world energy 2024. https://www.energyinst.org/statistical-review
Food and Agriculture Organization (FAO). (2023). Inorganic fertilizers: FAOSTAT domain update. https://openknowledge.fao.org
OE Digital. (2026, March 3). Shell’s Brazil oil ‘enormous opportunities’ amid Middle East conflict. https://energynews.oedigital.com/oil-gas/2026/03/03/shells-brazil-oil-enormous-opportunities-amid-middle-east-conflict
Atlantic Council. (2026, April 10). How the Iran war could shift energy policies around the world. https://www.atlanticcouncil.org/blogs/energysource/how-the-iran-war-could-shift-energy-policies-around-the-world/International Fertilizer Association (IFA). (2023). Short-term fertilizer outlook 2023-2024. https://www.fertilizer.org
ExxonMobil Guyana Limited. (2025, November 12). Daily oil production hits 900,000 barrels in Guyana’s Stabroek Block. https://corporate.exxonmobil.com/locations/guyana/news-releases/11122025-daily-oil-production-hits-900000-barrels-in-guyanas-stabroek-block
Latin America Reports. (2026). What the halt in the Strait of Hormuz means for Latin America. https://latinamericareports.com/what-the-halt-in-the-strait-of-hormuz-means-for-latin-america/13836/
Semafor. (2026, March 12). LatAm oil exporters boosted by Strait of Hormuz closure. https://www.semafor.com/article/03/12/2026/latam-oil-exporters-boosted-by-strait-of-hormuz-closure
The Financial World. (2026). Oil shock redraws Latin America’s political and currency outlook. https://www.financial-world.org/news/news/financial/30454/oil-shock-redraws-latin-americas-political-and-currency-outlook/
UNCTAD. (2026). Strait of Hormuz disruptions: Implications for global trade and development (UNCTAD/OSG/TT/INF/2026/1). https://unctad.org/publication/strait-hormuz-disruptions-implications-global-trade-and-development
U.S. Energy Information Administration (EIA). (2025, December). Short-term energy outlook. https://www.eia.gov/outlooks/steo/
Trading Economics. (2026). Crude oil price, chart, historical data. Retrieved April 14, 2026, from https://tradingeconomics.com/commodity/crude-oil
Zawya. (2026). Shell sees enormous opportunity for Brazil oil amid Middle East conflict. https://www.zawya.com/en/business/energy/shell-sees-enormous-opportunity-for-brazil-oil-amid-middle-east-conflict-c6ra3qb7