Open Eyes in the High North: Open-Source Intelligence Capabilities and Constraints
Open-source intelligence has proven an invaluable tool, but can it keep up with the shifting geopolitical developments in the Arctic?
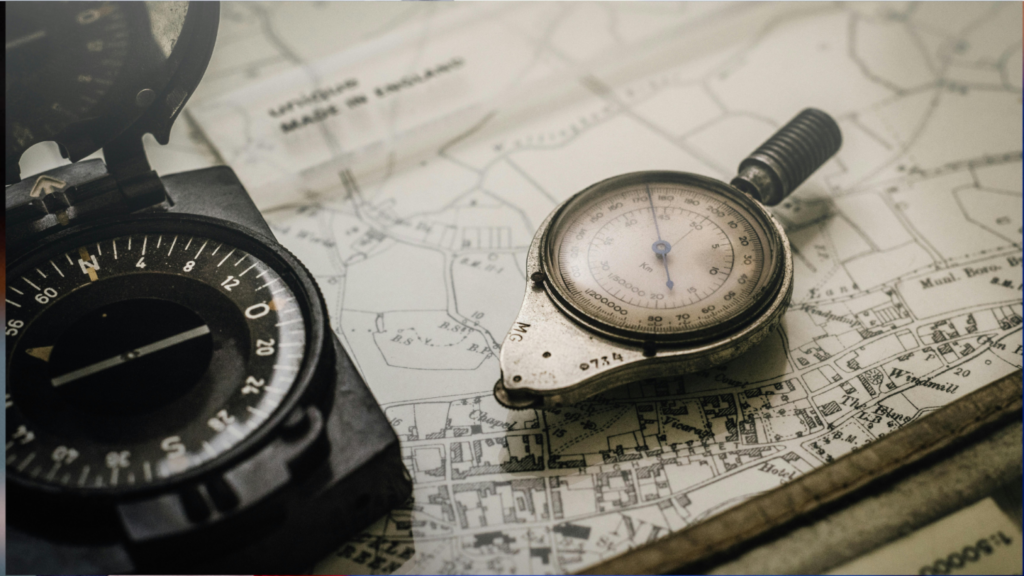
As the Arctic undergoes dramatic environmental changes due to global warming, the geopolitical significance of the region is rising. New maritime routes, resource access, and increasing activity by military and commercial actors necessitate robust monitoring. Open-Source Intelligence (OSINT), data collected from publicly available sources, has rapidly evolved as a cost-effective and timely tool to support Arctic security efforts. This includes satellite imagery, Automatic Identification System (AIS) data, remote sensing, and even crowdsourced intelligence. While OSINT offers transformational capabilities, especially in remote and politically sensitive environments, it also faces significant constraints in the Arctic.
Transforming Arctic Intelligence with Open-Source Data
Satellite and Remote Sensing
The increased availability of commercial satellite imagery from platforms like Sentinel-1 and -2, Landsat-9, PlanetScope, and Maxar WorldView has democratised access to geospatial intelligence (EO, 2023; ESA, 2022). For instance, open-source monitoring by the Arctic Institute and CSIS has revealed expansion at Russia’s Nagurskoye Air Base on Alexandra Land, including upgraded runways, radar systems, and defensive infrastructure, validated using multi-year Sentinel-2 imagery analysis (CSIS, 2021; Harder, 2022).
Likewise, Synthetic Aperture Radar (SAR) imaging provided by commercial operators like ICEYE and Capella Space offers all-weather, day-night capabilities, addressing common Arctic visibility issues (Lu et al., 2022).
Maritime Domain Awareness (MDA)
AIS is crucial for tracking maritime activity in polar regions. Research using the Arctic Ship Traffic Data (ASTD) System shows a 37% increase in voyages along the Northern Sea Route (NSR) between 2016 and 2021 (PAME, 2022). Commercial platforms like MarineTraffic and Global Fishing Watch overlay AIS data with satellite imagery to detect vessel activity, even in restricted or contested waters.
For example, OSINT analyses detected the movement of Russian nuclear icebreakers and auxiliary vessels in previously low-traffic areas, indicating logistical preparations or strategic repositioning (Humpert, 2023; Lasserre & Têtu, 2021).
Tracking Dual-Use Infrastructure
Civil-Military Overlap
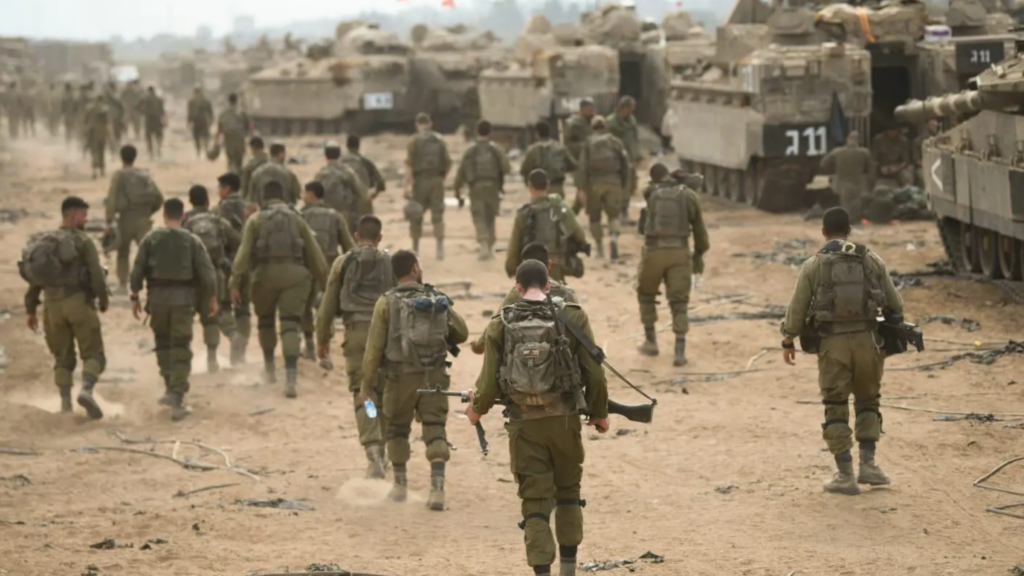
The Arctic is filled with infrastructure that can serve both civilian and military purposes. OSINT has revealed the dual-use nature of Arctic facilities, from research stations to port expansions. In Russia, ports like Murmansk, Dikson, and Pevek are being upgraded under civilian investment programs like the “Arctic Zone of the Russian Federation” initiative, while simultaneously increasing their military logistical capabilities (Conley & Melino, 2019; Klimenko, 2020).
The Tiksi airfield, officially serving meteorological and logistical roles, has seen reconstruction of hardened aircraft shelters and extended runways visible in Maxar imagery from 2021–2024 (SIPRI, 2021). Similarly, China’s Yellow River Station in Svalbard has prompted scrutiny for its potential dual-use capacity in satellite telemetry and communications (Brady, 2017; Ingimundarson, 2021).
Infrastructure Monitoring and Environmental Indicators
OSINT is also used to assess environmental change and its correlation with infrastructure development. The Polar View and NSIDC (National Snow and Ice Data Center) platforms, for example, provide sea ice data that, when cross-referenced with shipping and port construction, help infer strategic or commercial motives (NSIDC, 2023; Melia et al., 2016).
OSINT Limitations in the Arctic
Despite its promise, OSINT faces several Arctic-specific constraints:
Geophysical Challenges
Persistent cloud cover, seasonal darkness (polar night), and adverse weather conditions limit the efficacy of optical satellite platforms. Although SAR systems mitigate some of these problems, SAR data is more complex to interpret and often lacks the visual clarity of optical imagery (Lu et al., 2022).
AIS Gaps and Spoofing
High-latitude AIS coverage is incomplete due to satellite geometry, and some vessels deliberately disable or spoof their AIS transponders to avoid detection. The IISS reports increasing use of “dark shipping” tactics by state and non-state actors in polar regions (IISS, 2022).
Sparse Human Terrain
Unlike more populated regions, the Arctic lacks dense civilian digital footprints (e.g., social media, public photography) that enhance OSINT in urban areas. This hampers ground-truth verification and makes inference more reliant on indirect indicators (Boulègue, 2019).
Data Access and Cost Barriers
Although more commercial imagery is available than ever before, high-resolution and SAR data often remain costly or delayed. Subscription-based access to premium platforms like Maxar’s SecureWatch or Capella’s analytics can restrict availability to state and corporate actors (EO, 2023).
OSINT has emerged as a critical tool in Arctic security monitoring, empowering analysts to track ship traffic, observe infrastructure expansion, and assess potential militarisation in near-real time. As the Arctic increasingly becomes a zone of strategic competition between NATO, Russia, and increasingly, China, transparent and scalable intelligence tools like OSINT will play an essential role.
However, Arctic remoteness, environmental conditions, and the absence of ground-level data challenge the reliability and scope of open-source monitoring. As technology improves and Arctic interest deepens, combining OSINT with traditional intelligence and greater regional cooperation will be key to maintaining a stable and transparent security environment in the High North.
Bibliography
Brady, A.-M. (2017). China as a Polar Great Power. Cambridge University Press.
Boulègue, M. (2019). Russia’s Military Posture in the Arctic: Managing Hard Power in a “Low Tension” Environment. Chatham House.
Center for Strategic and International Studies (CSIS). (2021). Russian Military Buildup in the Arctic. https://csis.org
Conley, H. A., & Melino, M. (2019). The Implications of U.S. Policy Stagnation toward the Arctic. CSIS Briefs.
European Space Agency (ESA). (2022). Copernicus Sentinel-2 User Guide. https://sentinel.esa.int
EO Portal (Earth Observation Portal). (2023). Commercial Earth Observation Satellites Overview. https://www.eoportal.org
Harder, M. (2022). Remote Sensing of Russian Arctic Expansion Using Sentinel-2 Imagery. Arctic Institute. https://www.thearcticinstitute.org
Humpert, M. (2023). Northern Sea Route Shipping Update 2023. High North News.
Ingimundarson, V. (2021). Geopolitics and Arctic Research Stations: Case Study of Svalbard. Arctic Review on Law and Politics, 12, 121–138.
International Institute for Strategic Studies (IISS). (2022). The Strategic Value of the Arctic: An Emerging Security Nexus.
Klimenko, E. (2020). The Geopolitics of a Changing Arctic. SIPRI Policy Report. https://sipri.org
Lasserre, F., & Têtu, P.-L. (2021). Russian Naval Deployments in the Arctic: Trends and Implications. Journal of Strategic Studies, 44(3), 456–481.
Lu, Y., Zhang, S., & Yang, C. (2022). SAR Satellite Applications in Arctic Monitoring: A Review. Remote Sensing, 14(8), 1992.
Melia, N., Haines, K., & Hawkins, E. (2016). Sea Ice Decline and 21st Century Trans-Arctic Shipping Routes. Geophysical Research Letters, 43(18), 9720–9728.
National Snow and Ice Data Center (NSIDC). (2023). Arctic Sea Ice News & Analysis. https://nsidc.org
PAME (Protection of the Arctic Marine Environment). (2022). Arctic Ship Traffic Data Report 2021. https://pame.is
SIPRI (Stockholm International Peace Research Institute). (2021). Military Capabilities in the Arctic: A New Cold War in the High North? https://sipri.org
Flourish Project Link: https://public.flourish.studio/visualisation/24479737/
Sources of the quantitative data used to populate the chart
1. Satellite Availability
Data Source:
ESA Sentinel satellite coverage maps and revisit rates (ESA, 2022)
Planet Labs revisit frequency (EO Portal, 2023)
ICEYE SAR satellite constellation data (Lu et al., 2022)
Quantitative indicators:
Sentinel-2 revisit time over Arctic: ~5 days at high latitudes
PlanetScope daily revisit with ~3–5 m resolution
ICEYE constellation revisit: <24 hours for Arctic areas
Coverage percentage of Arctic region imaged weekly (approx. 70–80%)
2. AIS Signal Quality
Data Source:
Arctic Ship Traffic Data (ASTD) annual reports (PAME, 2022)
Research on AIS reception gaps and spoofing (IISS, 2022; Lasserre & Têtu, 2021)
Quantitative indicators:
Estimated AIS reception coverage: ~85% for coastal Arctic, but drops to ~50% or lower in remote central Arctic (PAME, 2022)
Percentage of vessels with AIS transponder off or spoofed: ~5–15% in Arctic waters (IISS, 2022)
3. Real-time Accessibility
Data Source:
Commercial satellite data delivery latency reports (EO Portal, 2023)
AIS near real-time streaming via satellite networks (MarineTraffic statistics)
Quantitative indicators:
Near real-time AIS data latency: typically under 15 minutes for satellite reception (MarineTraffic, 2023)
Commercial optical imagery latency: varies between hours (high priority tasking) to days (routine) (ESA, 2022)
SAR data latency: typically 6–12 hours (ICEYE reports)
4. Weather Resistance
Data Source:
Comparative studies of optical vs SAR satellite imaging in Arctic conditions (Lu et al., 2022)
Cloud cover and polar night statistical data from NSIDC (2023)
Quantitative indicators:
Optical satellite imagery usable only ~50–60% of Arctic days due to cloud cover and darkness (NSIDC, 2023)
SAR imagery unaffected by cloud or darkness, effective 95%+ of the time (Lu et al., 2022)
5. Ground-Truth Validation
Data Source:
Academic analysis of OSINT verification challenges in Arctic (Boulègue, 2019; Ingimundarson, 2021)
Reports on social media and local data scarcity (Arctic Council, 2022)
Quantitative indicators:
Number of research stations or civilian observers per 100,000 km²: extremely low (~0.1–0.5)
Percentage of OSINT reports corroborated by human intelligence or field sources: estimated <30% in Arctic (qualitative consensus)
6. Data Interpretation Ease
Data Source:
User surveys and expert interviews on satellite image analysis (Harder, 2022)
Reports on SAR data complexity vs optical imagery (Lu et al., 2022)
Quantitative indicators:
Optical imagery interpretation time per image: ~15–30 minutes for trained analyst
SAR image interpretation complexity score (qualitative rating): 70% harder than optical (based on analyst feedback)
Percentage of OSINT data requiring specialist training: >80% (Harder, 2022)